Published on May 22, 2021

Machine Learning-Optimized Synthesis of Doped TiO2 with Improved Photocatalytic Performance: A Multi-Step Workflow Supported by Designed Wet-Lab Experiments

Journal of Alloys and Compounds


First Author: bowen.gao

Keywords: machine learning , photocatalysis

Abstract

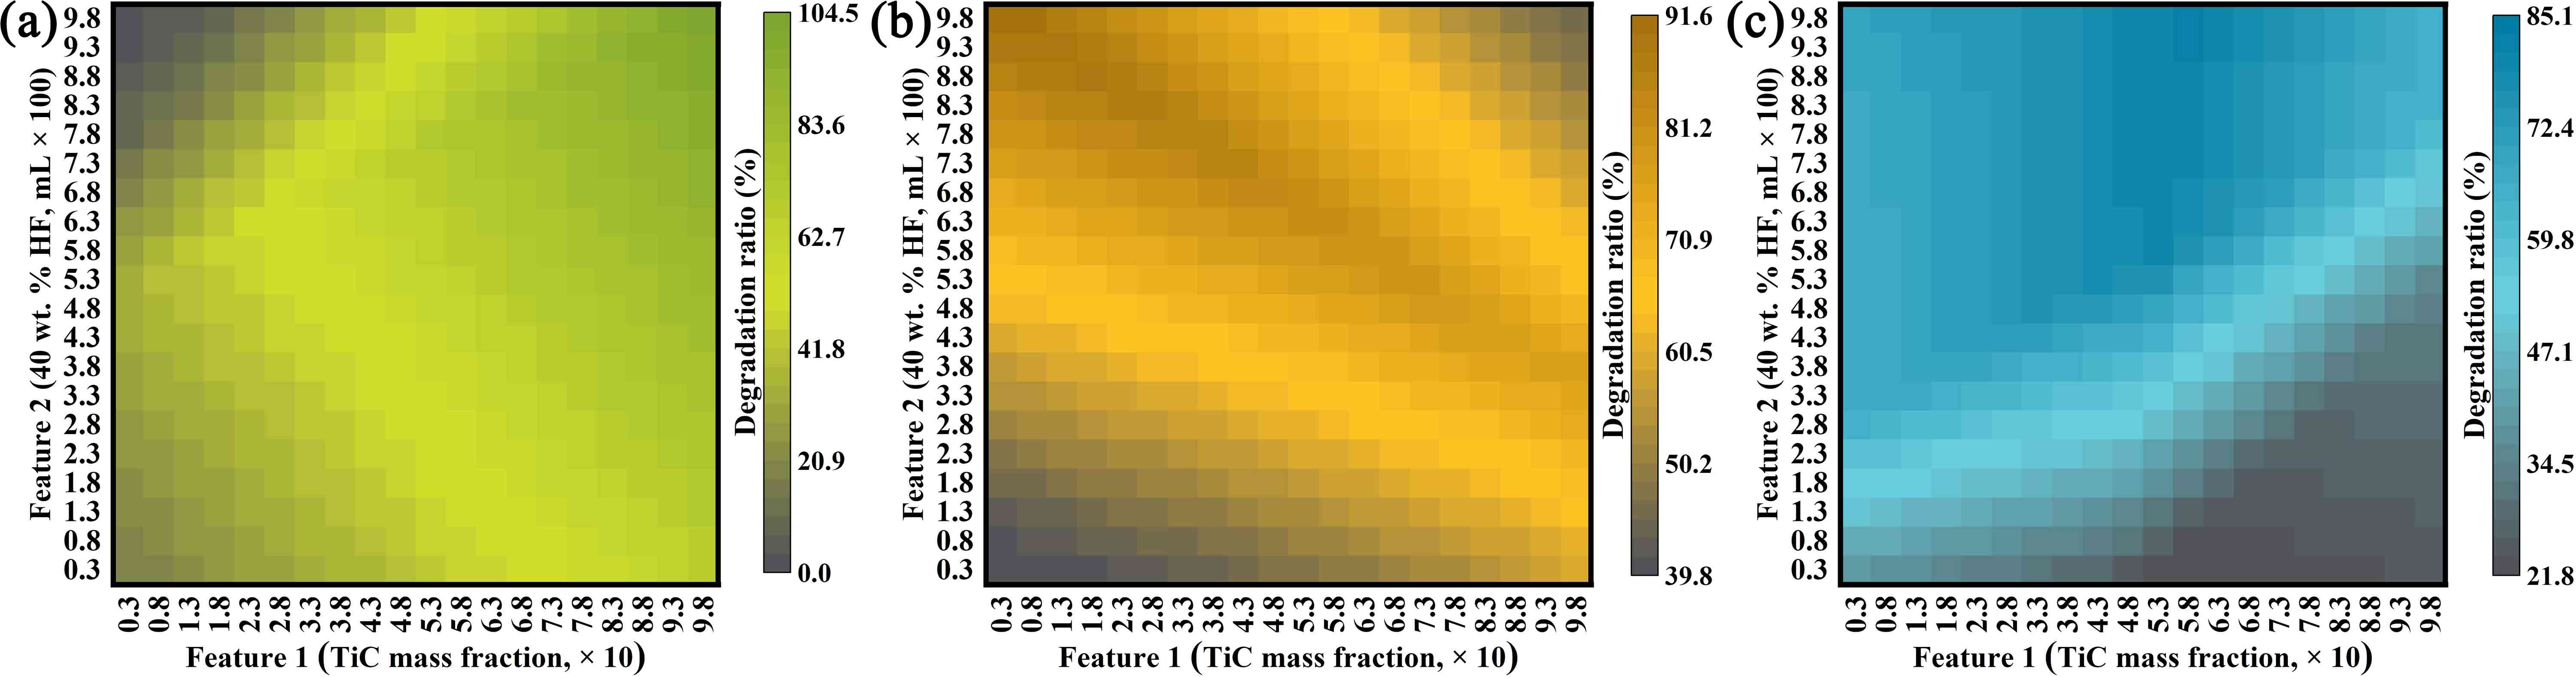
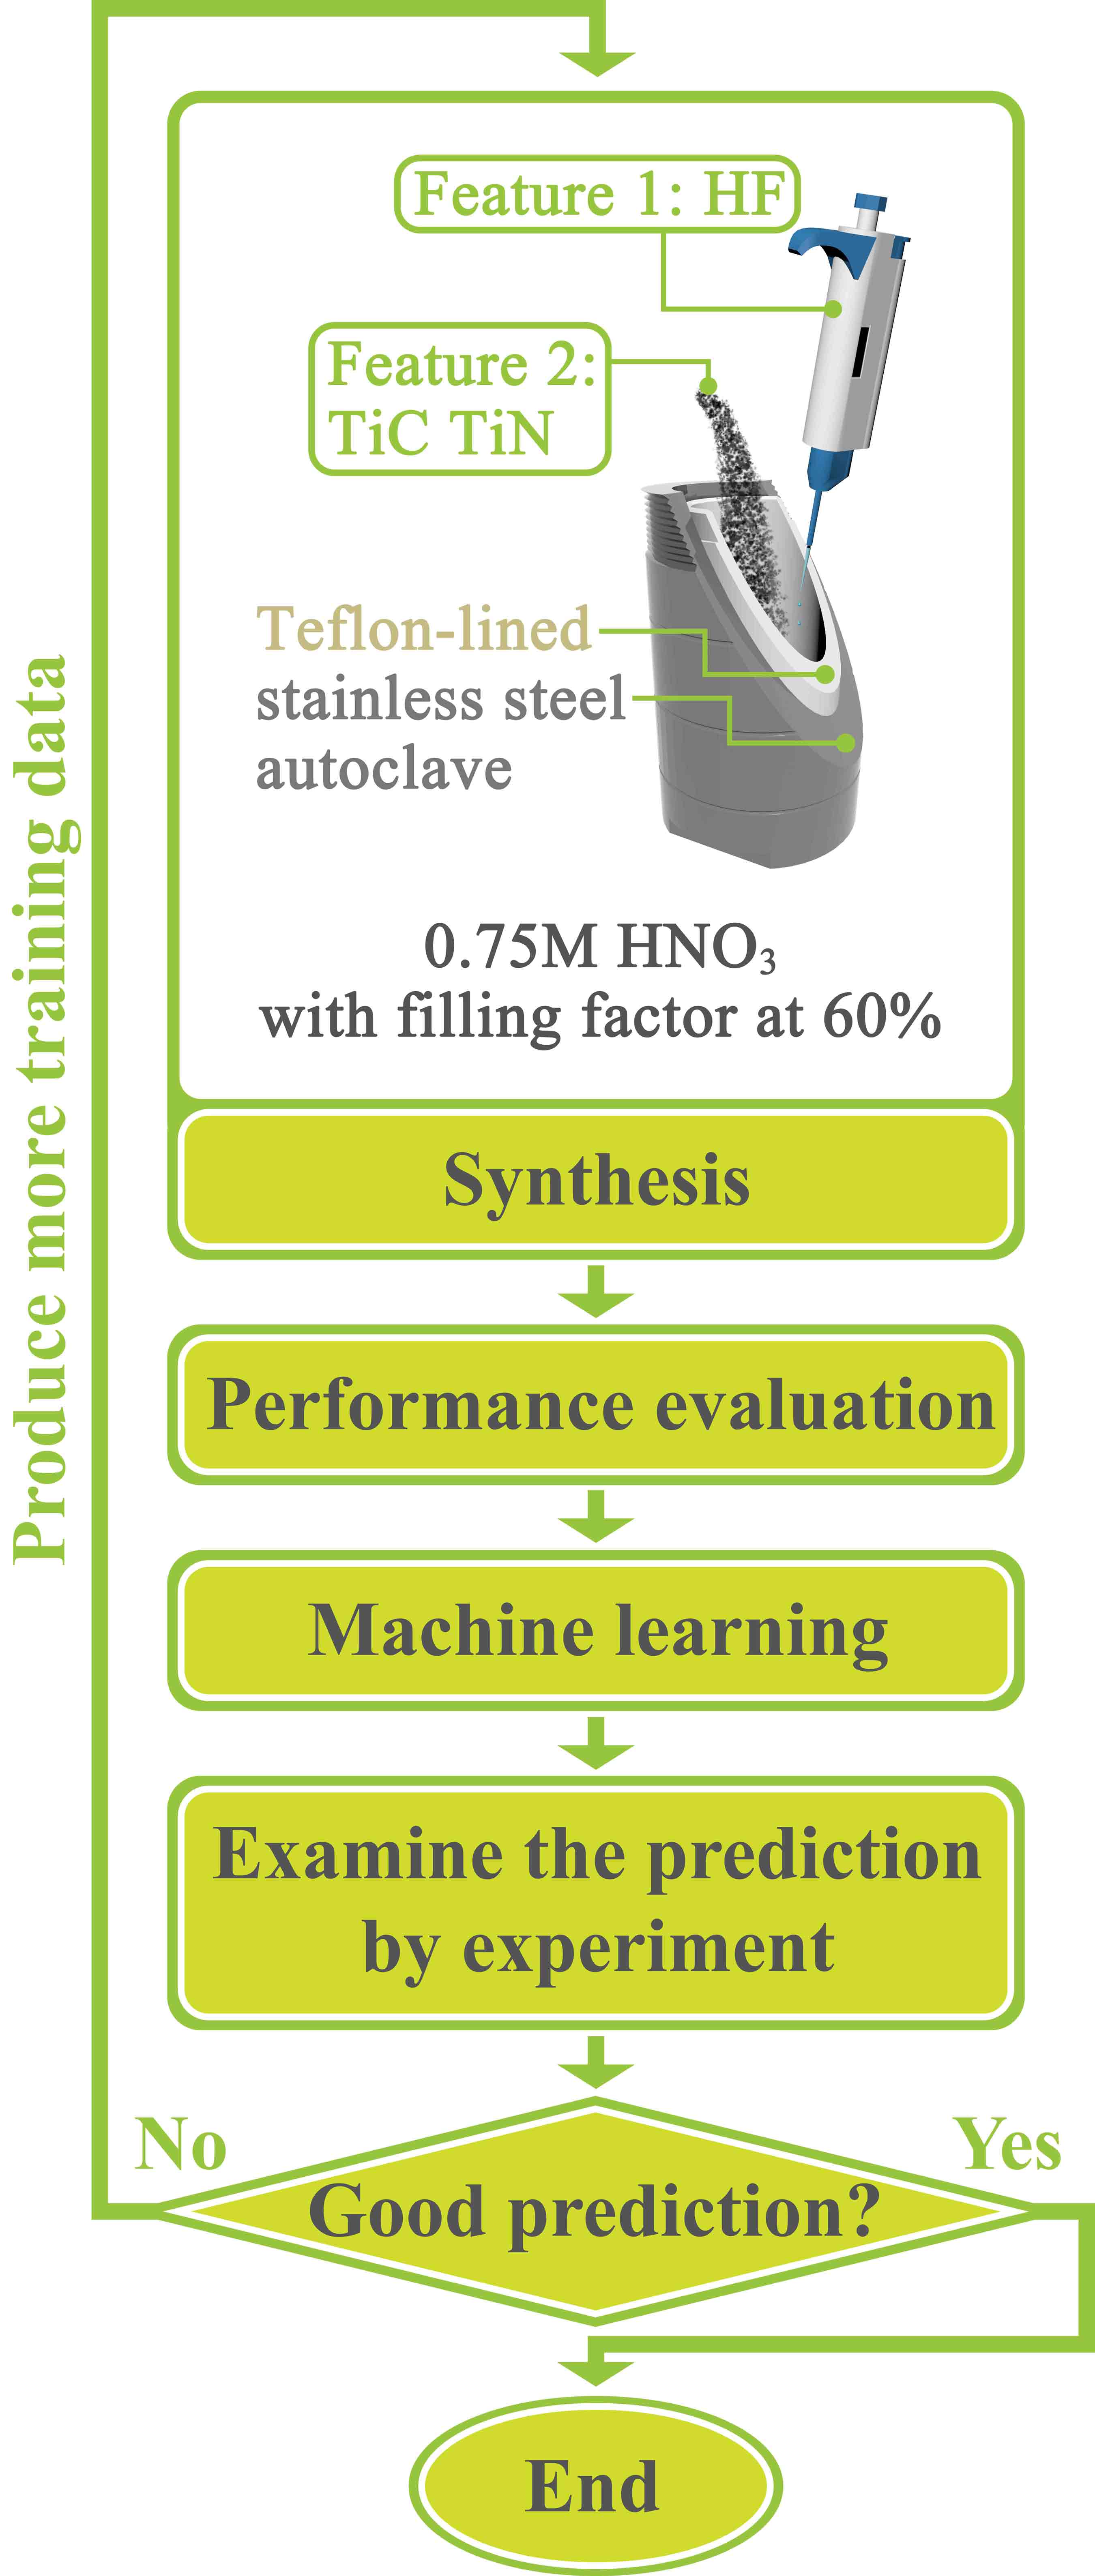
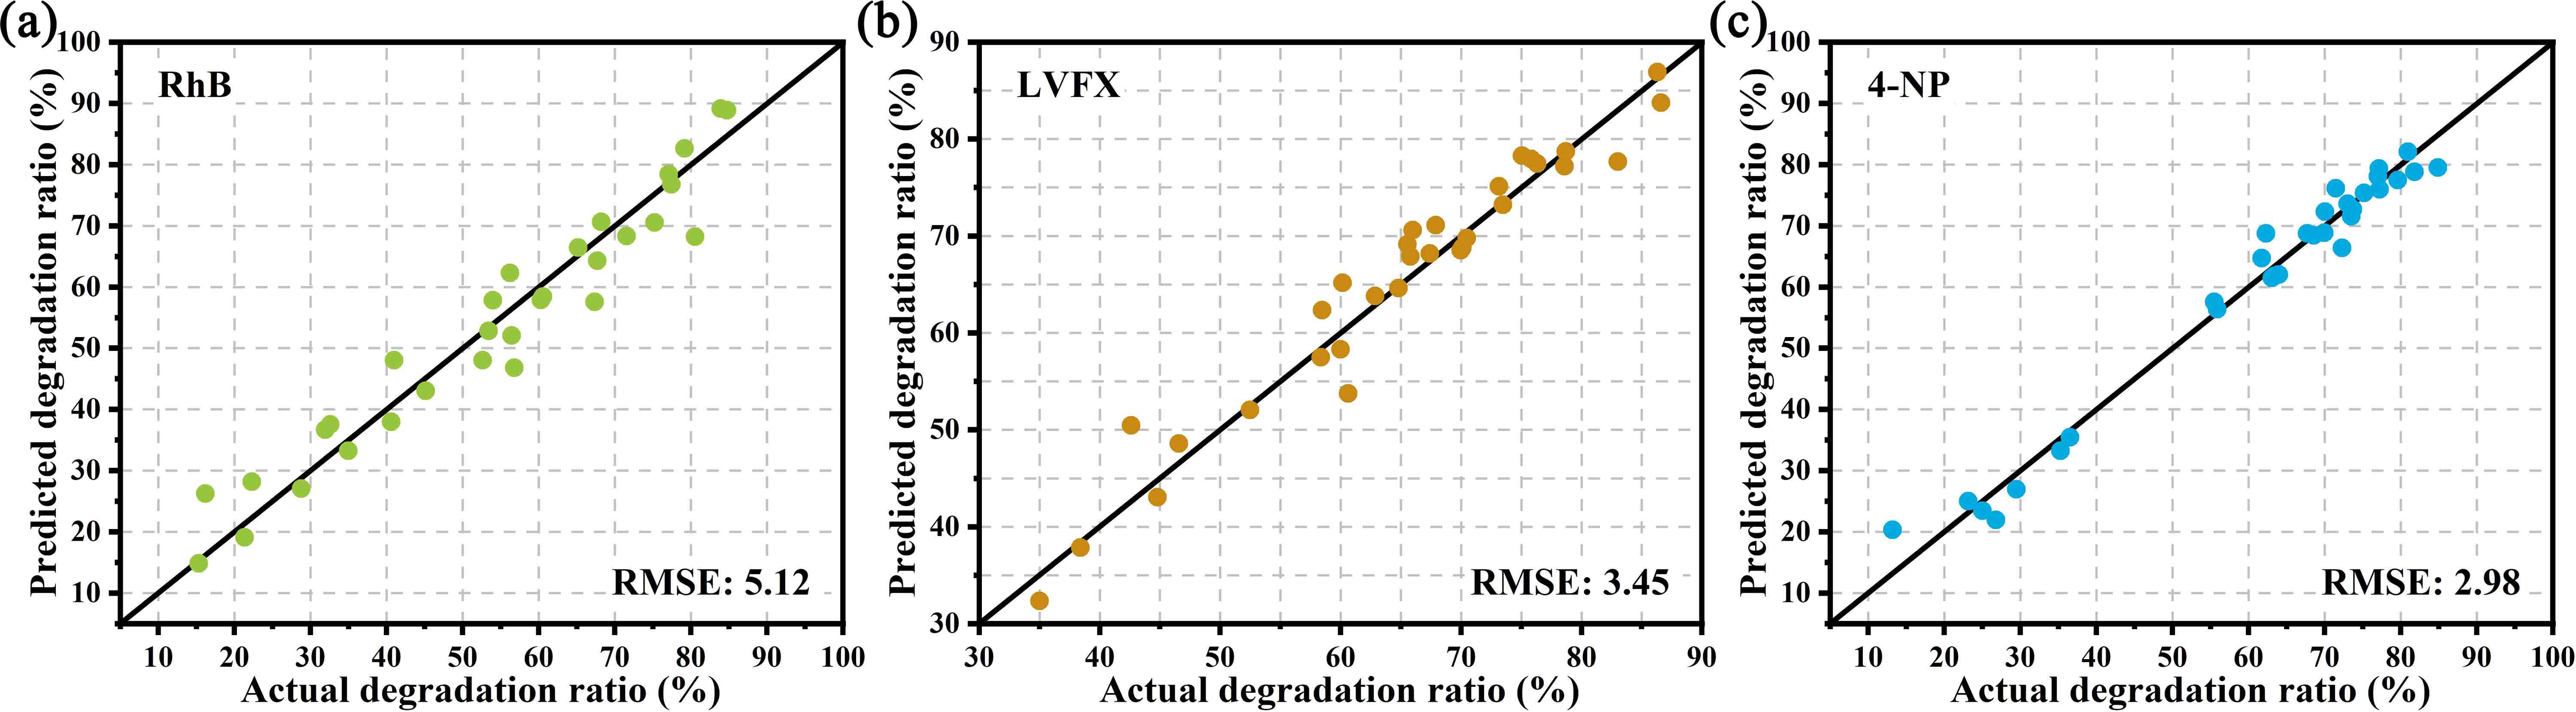
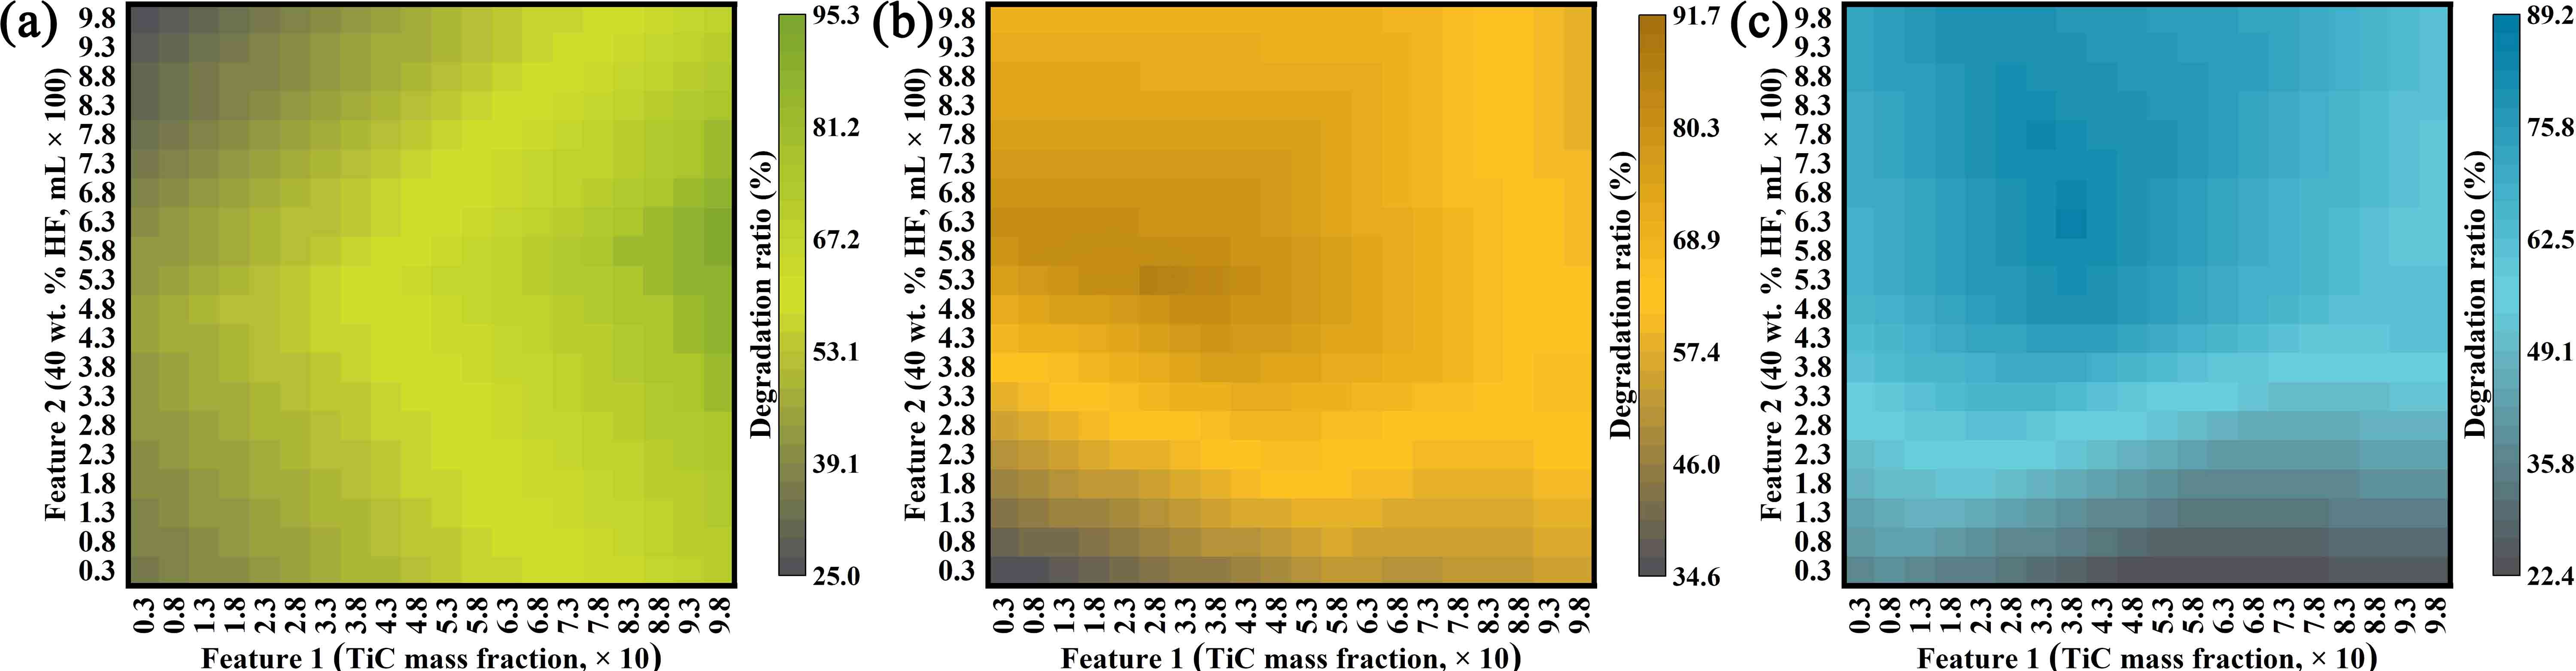
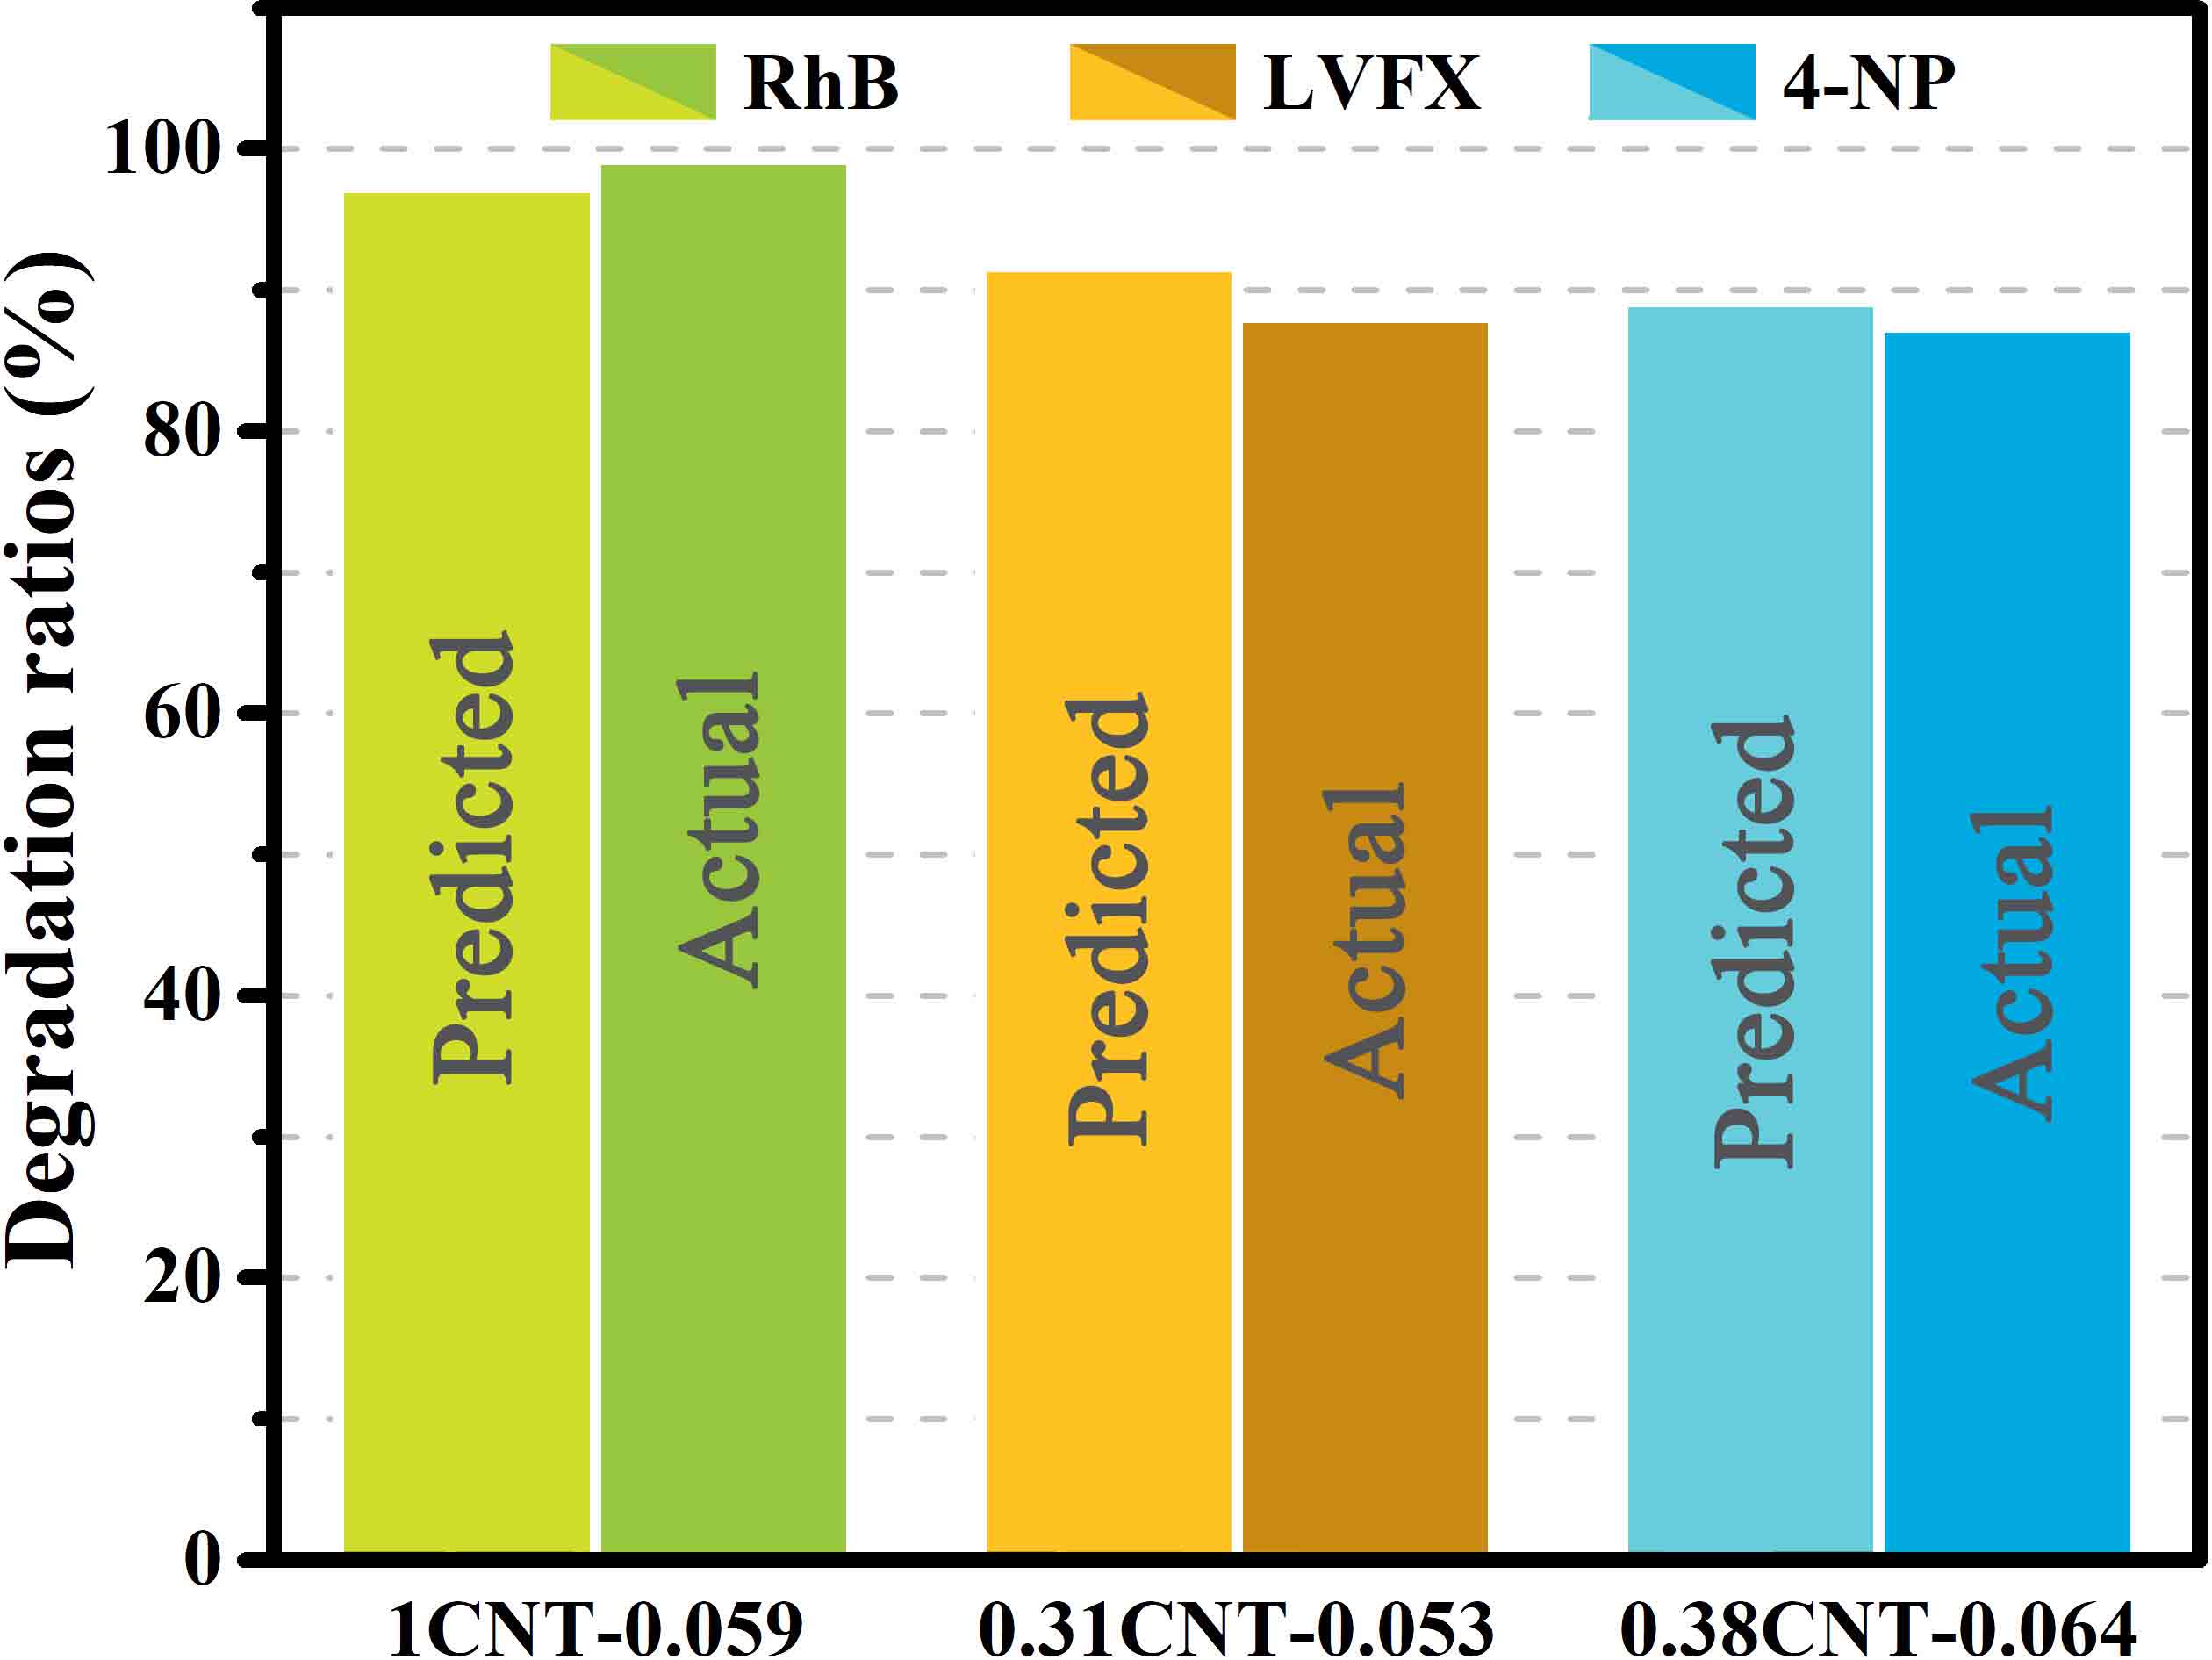
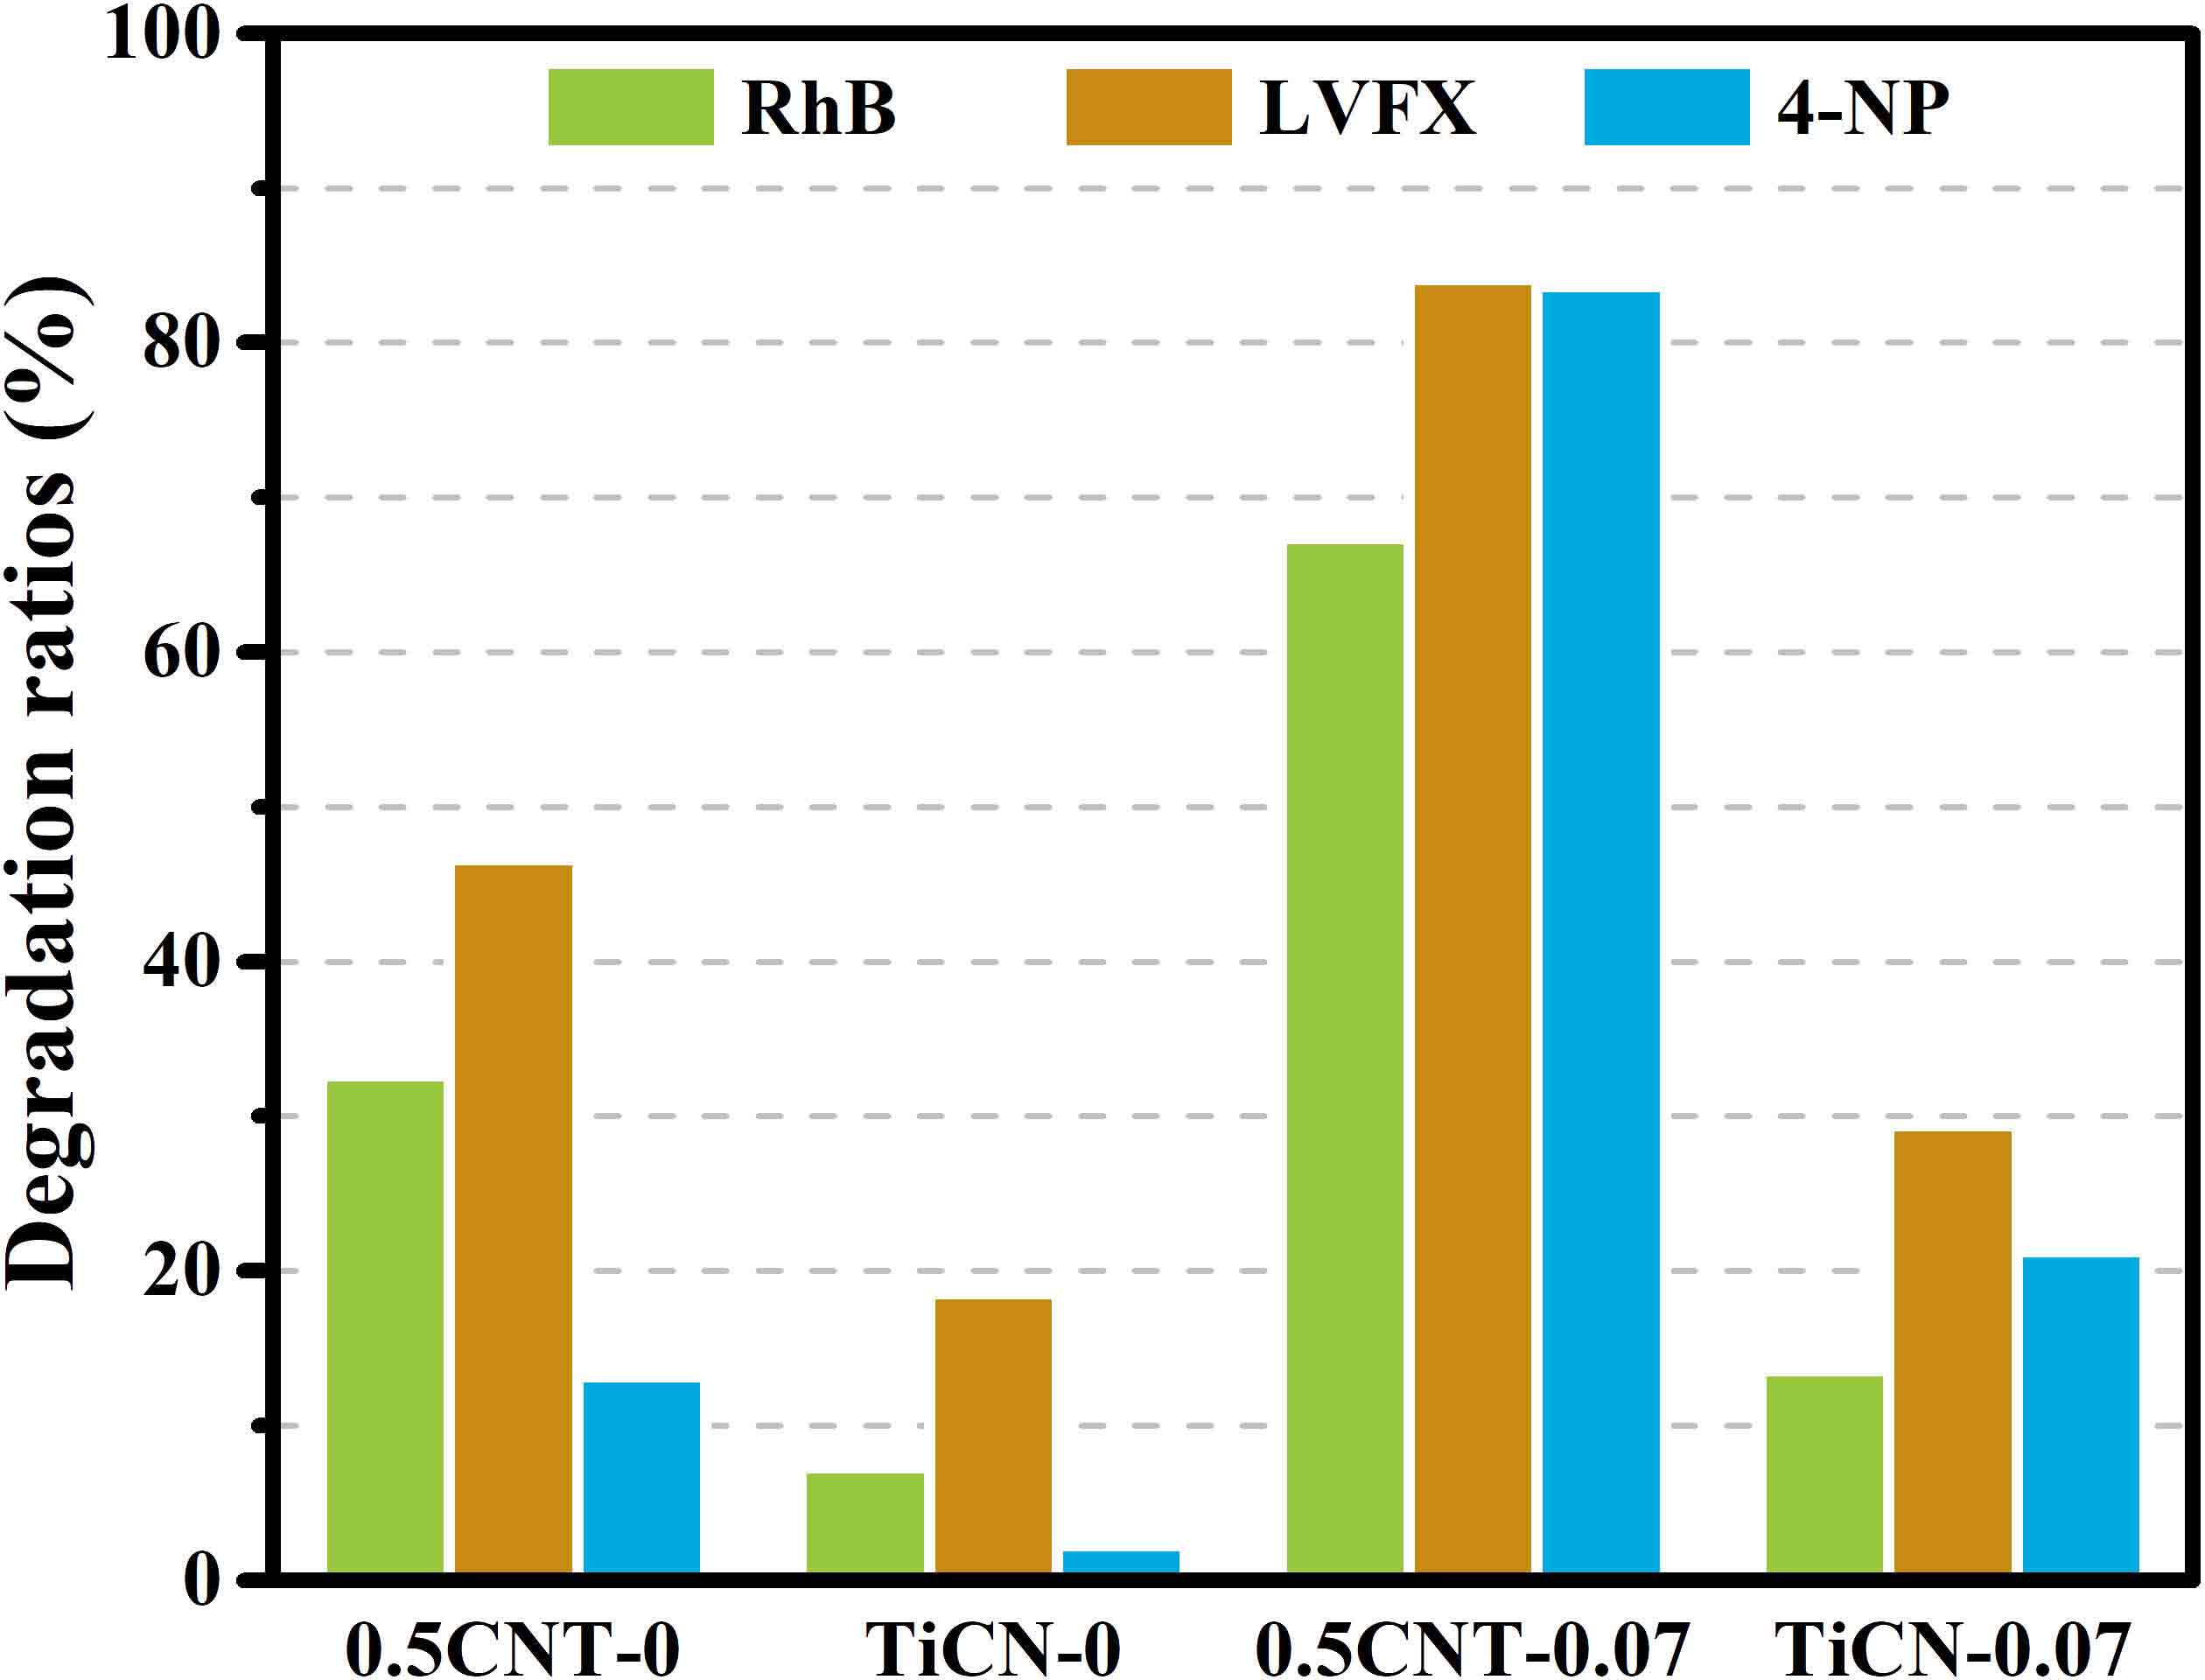
A paradigm for material synthesis is demonstrated under the guidance of machine learning as well as the designed wet-lab experiments. This work begins with a series of well-tailored experiments, including the synthesis of C/N-codoped TiO2 nanoparticles with exposed anatase {001} facets and its photocatalytic performance evaluations. In advance of applying machine learning, the underlying synergistic effects are revealed and expounded in detail purely based on wet-lab experiments. Then, the idea of active learning is adopted by implementing a multi-step workflow to iterate the experiments around preferred synthesis conditions, and unravel the optimum synthesis parameters with the assistance of machine learning. In this work, the prediction models are built on a solid physical and chemical understanding, rather than a ‘black box approach’. To this end, the designed experiments as well as the bootstrapping technique together guarantee a good prediction with less training. The compatibility of the artificial neural network and wet-lab experiment also endows the current strategy with several innate advantages. Moreover, controlled experiments with different starting materials were carried out. The results suggest that, in an effort to ensure more accurate predictions, further restrictions could be placed on data collection prior to the stage of introducing machine learning, and the design of wet-lab experiment plays a crucial role in facilitating machine learning. Lastly, the future prospect for machine learning-assisted material synthesis is briefly discussed based on the current work.

Images

A general comparison between the wet-lab experiment and machine learning, which share an analogous methodology.

Fig. 1 A general comparison between the wet-lab experiment and machine learning, which share an analogous methodology.

XRD patterns for three groups of samples (a-c). All the tests were carried out on a Panalytical X′ Pert X-ray diffractometer equipped with Cu-K<sub>α</sub> radiation using 40 kV accelerating voltage and 40 mA applied current.

Fig. 2 XRD patterns for three groups of samples (a-c). All the tests were carried out on a Panalytical X′ Pert X-ray diffractometer equipped with Cu-Kα radiation using 40 kV accelerating voltage and 40 mA applied current.

Schematic illustration of the ANN, which acts as a data-driven tool to precisely 
approximate the outer behavior of the training data.

Fig. 3 Schematic illustration of the ANN, which acts as a data-driven tool to precisely approximate the outer behavior of the training data.

Anatase phase ratios as a function of WTiC (a) and additional HF (b).

Fig. 4 Anatase phase ratios as a function of WTiC (a) and additional HF (b).

XPS spectra of 0.5CNT-0 sample were recorded on RBD upgraded PHI-5000C ESCA system (PerkinElmer) with Al/Mg K<sub>α</sub> radiation. Thereinto, the survey spectrum (a), high-resolution XPS spectrum of N 1s (b), and high-resolution XPS spectrum of C 1s (c) are investigated.

Fig. 5 XPS spectra of 0.5CNT-0 sample were recorded on RBD upgraded PHI-5000C ESCA system (PerkinElmer) with Al/Mg Kα radiation. Thereinto, the survey spectrum (a), high-resolution XPS spectrum of N 1s (b), and high-resolution XPS spectrum of C 1s (c) are investigated.

Pseudo phase diagram of anatase phase ratios versus WTiC with sampling points form ‘group 1’ to ‘group 3’.

Fig. 6 Pseudo phase diagram of anatase phase ratios versus WTiC with sampling points form ‘group 1’ to ‘group 3’.

Comparison of experimentally derived degradation ratios of RhB (a), LVFX (b), and 4-NP (c) versus the predictions made with ML by first round of training. Thereinto, RMSE represents root mean squared error of the predicted values with respect to the experimental values.

Fig. 7 Comparison of experimentally derived degradation ratios of RhB (a), LVFX (b), and 4-NP (c) versus the predictions made with ML by first round of training. Thereinto, RMSE represents root mean squared error of the predicted values with respect to the experimental values.

Heatmaps of the predicted degradation ratios over RhB (a), LVFX (b), and 4-NP (c) as a function of feature 1 and feature 2. The current predictions are based on the training data from ‘group 1’ to ‘group 3’ (Table S1).

Fig. 8 Heatmaps of the predicted degradation ratios over RhB (a), LVFX (b), and 4-NP (c) as a function of feature 1 and feature 2. The current predictions are based on the training data from ‘group 1’ to ‘group 3’ (Table S1).

Flowchart of the multi-step workflow with an active learning strategy used to approximate the optimum synthesis parameters.

Fig. 9 Flowchart of the multi-step workflow with an active learning strategy used to approximate the optimum synthesis parameters.

Comparison of experimentally derived degradation ratios of RhB (a), LVFX (b), and 4-NP (c) versus the predictions made with ML by second round of training. Thereinto, RMSE represents root mean squared error of the predicted values with respect to the experimental values.

Fig. 10 Comparison of experimentally derived degradation ratios of RhB (a), LVFX (b), and 4-NP (c) versus the predictions made with ML by second round of training. Thereinto, RMSE represents root mean squared error of the predicted values with respect to the experimental values.

Heatmaps of the predicted degradation ratios over RhB (a), LVFX (b), and 4-NP (c) as a function of feature 1 and feature 2. The current predictions are based on the training data from ‘group 1’ to ‘group 5’ (Table S1 and Table S3).

Fig. 11 Heatmaps of the predicted degradation ratios over RhB (a), LVFX (b), and 4-NP (c) as a function of feature 1 and feature 2. The current predictions are based on the training data from ‘group 1’ to ‘group 5’ (Table S1 and Table S3).

Comparisons between the experimentally derived and predicted degradation ratios over three different contaminants.

Fig. 12 Comparisons between the experimentally derived and predicted degradation ratios over three different contaminants.

Comparisons between the degradation performance of C/N-codoped TiO<sub>2</sub> catalysts under the same evaluation criteria. Thereinto, 0.5CNT-0 and 0.5CNT-0.07 catalysts are obtained by TiC and TiN, while TiCN-0 and TiCN-0.07 catalysts are prepared with TiCN. The catalysts with same doping content but different starting materials shows obviously different degradation performance over all three contaminants.

Fig. 13 Comparisons between the degradation performance of C/N-codoped TiO2 catalysts under the same evaluation criteria. Thereinto, 0.5CNT-0 and 0.5CNT-0.07 catalysts are obtained by TiC and TiN, while TiCN-0 and TiCN-0.07 catalysts are prepared with TiCN. The catalysts with same doping content but different starting materials shows obviously different degradation performance over all three contaminants.